Methane Mattered More in the Early 20th Century
Emissions swamped radiative transfer

Zeke Hausfather had an interesting post recently at The Climate Brink on what drove early 20th Century warming, suggesting it was a roughly equal mix of human activity, natural forcings (volcanoes) and internal variability/observational uncertainty. Among the anthropogenic forcings, I was surprised by the relative size of methane’s contribution: 0.06°C between 1900 and 1945, compared to 0.16°C for CO2 (37.5%).
This seemed large, so I looked at the IPCC AR6 radiative forcing estimates (Table AIII.3 here). From 1900-1950 the methane forcing grew by 0.12Wm-2, compared to 0.3Wm-2 for CO2 (~40%), while from 1960-2010 the methane forcing grew by 0.23Wm-2, compared to 1.14Wm-2 for CO2 (~20%).
So the methane contribution was about half as important over the last 50 years as it was over the first half of the 20th century. Initially, I was a bit surprised by this because the radiative transfer suggests methane’s radiative forcing would have become relatively more important over time. CO2 forcing goes as log(CO2), whereas a common parameterization for the forcing from methane, which is less saturated than CO2, is √CH4 (see more on this below). For the same proportional rate of concentration growth, we’d expect methane forcing to grow faster than carbon dioxide. Here’s a quick plot:
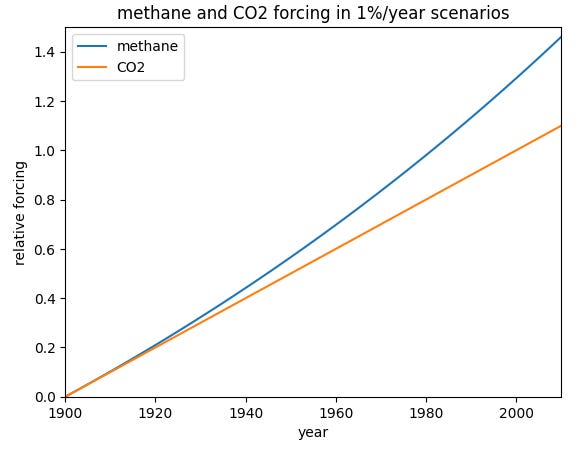
The relative weakening of the methane forcing means that either CO2 emissions grew much faster than methane emissions or that CH4 was sucked out of the atmosphere much more efficiently. IPCC Table AIII.1 shows that from 1900-1950 methane concentrations grew from 925 to 1164 ppb (25% increase), and from 1960-2010 they grew from 1264 ppb to 1798 ppb (42%). CO2 grew from 296.4 ppm to 313.1 ppm (5%), then from 316.8 to 388.6 ppm (23%). Methane grew proportionally faster, but the rate of CO2 increase was much larger in the second half of the century.
Our World in Data has some nice graphs of historical emissions: annual CO2 emissions went from 6.42 billion tonnes in 1900 to 43.18 billion tonnes today (x6.7), while annual CH4 emissions went from 1.92 billion CO2 tonne equivalents to 9.5 billion CO2 tonne equivalents (x4.5). More granularly, CO2 emissions really took off after WW2, while methane emissions actually flattened out a bit after the mid-1970s.
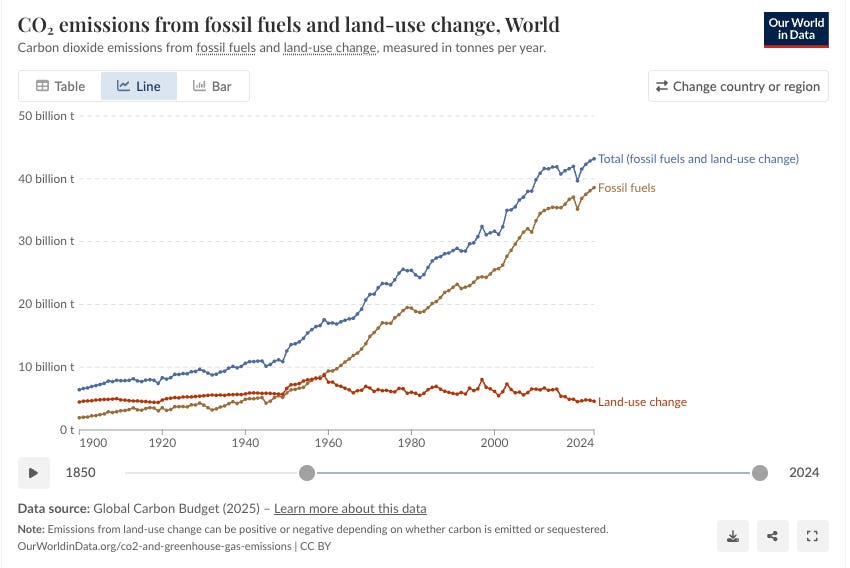
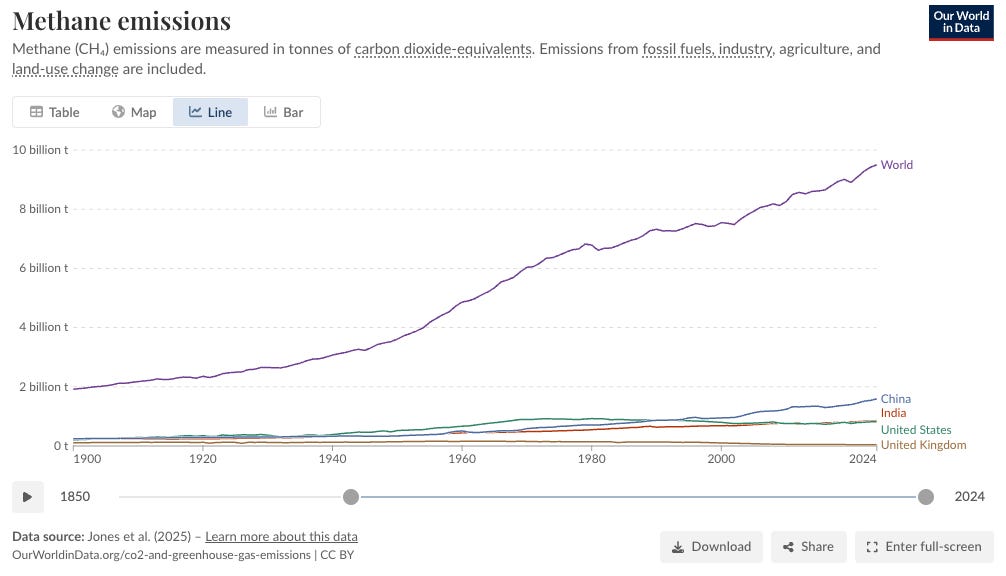
Looking at sources of the emissions, methane mostly comes from agriculture, fossil fuel extraction and waste (landfill emissions) while CO2 emissions come almost entirely from fossil fuel burning, especially after WW2. These different sources explain the decoupling of the emissions: methane is tied to agriculture and population growth, and CO2 to fossil fuel production.
Methane does have a much shorter lifetime in the atmosphere than CO2 – roughly 10 years compared to hundreds of years — so it’s possible changes in the sinks were a factor. It’s hard to directly compare the two since methane concentrations reflect the last ~10 years of emissions while carbon dioxide growth reflects cumulative emissions. Nevertheless, plotting the OWID emission data against the IPCC concentrations shows roughly linear relationships for both gases, and there’s no evidence of a mid-century break:
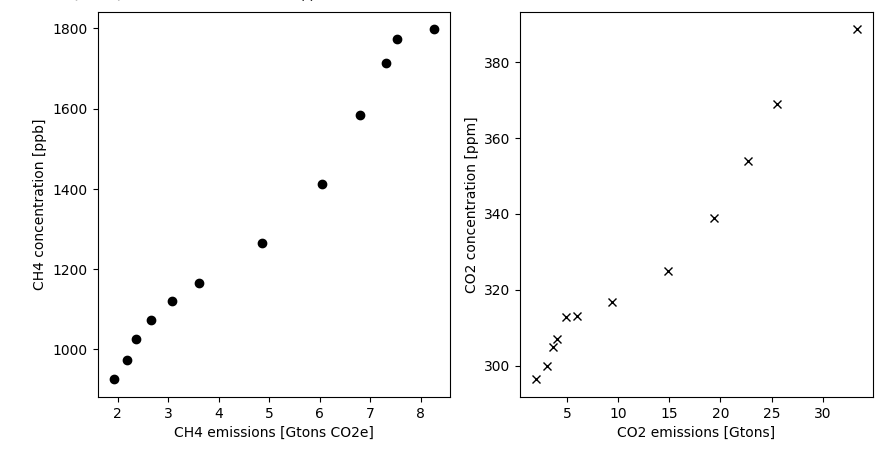
[Both concentrations did plateau in the mid-century, especially CO2 (see here for more), but this wouldn’t explain why methane forcing grew relatively more slowly.]
So before WW2, methane and carbon dioxide grew similarly, but since then the fossil-fuel-driven growth of CO₂ won out. I hadn't realized how much of total methane emissions comes from agriculture and waste. These could only grow so fast compared to the rapid growth of CO₂ emissions, and the √CH₄ vs log(CO₂) scaling difference got swamped by the post-war energy boom.
CO2 and CH4 Forcing
Czarnecki et al. have a really nice recent paper on radiative forcings across opacity regimes that is helpful for understanding the different CO2 and CH4 scalings. For both gases, the total forcing is a sum of a logarithmic contribution from the optically-thick part of their spectrum and a linear contribution from the optically-thin part:
F(C) = a log(C) + b C.
For CO2, the main 16 micron band is optically thick, so b is small and the forcing is well approximated as logarithmic:
F(CO2) = a log(CO2).
The lower concentrations of methane mean that its main bands aren’t as saturated, and there are contributions from optically-thick and optically-thin parts of the spectrum; a and b are comparable. This means the forcing can be approximated by a square root:
a log(CH4) + b CH4 ≅ c√CH4 + d
To see this, set CH4 = CH4,0(1 + x), then substitute Taylor expansions of log(1 + x) and √(1 + x). If the log and linear terms are comparable, the expressions agree to second order.
Thus for gases whose bands aren’t as saturated as CO2, like methane and N2O, the square root scaling is a good rule of thumb.